How do you give data a life of its own, from its inception to the various stage’s of transformation while celebrating the victories of its role in delivering on a larger business objective? That was the question we asked ourselves.
We are always exploring new ways to break down silos between data and design to build better products. Once we have gone through our data innovation sprint and outlined all of the potential models that can be built to deliver on your business goals we begin to explore how discrete models like lead scoring fit into a more expansive system interactions.
Exploring the possibilities
Creating a multidisciplinary team means that you already expanded your possibilities infinitely based on different mental models each person brings. Taking an integrative thinking approach at the front end of the design process gives teams a healthy way to explore opposing solutions to a problem space.
Example model outcome: What if we could combine 1st, 2nd, and 3rd party data to create more than just a lead score. What if our lead score were advanced segmentation that powered the entire customer experience.
Designing the system of relationships
Early-20th-century architect Eliel Saarinen’s advice to “always design a thing by considering it in its next larger context—a chair in a room, a room in a house, a house in an environment, an environment in a city plan”
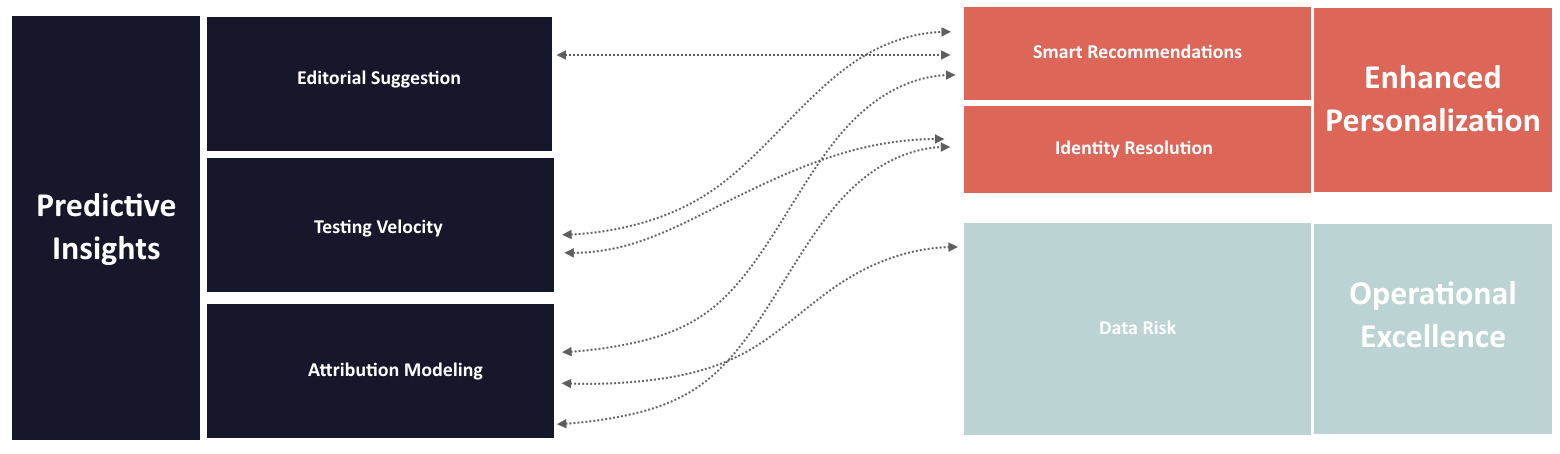
The intersection of how data flows and where it creates new interactions is a ideal place for design and data to combine perspectives to develop an optimal data journey. Getting the high-level system of models laid out is just the start, now it is time to show how each model will evolve from a set of different features into a data product that addresses a discrete insight, tailors a customer experience of informs another step in the process.
Visualizing the Data Journey
At Trovo, we have found that borrowing from the principles of customer experience design using journey mapping is a useful tool to align design and data teams. We have modified the approach to visualize the journey data takes along a lifecycle from how it’s created, how it is transformed, and what places will it surface along its path.
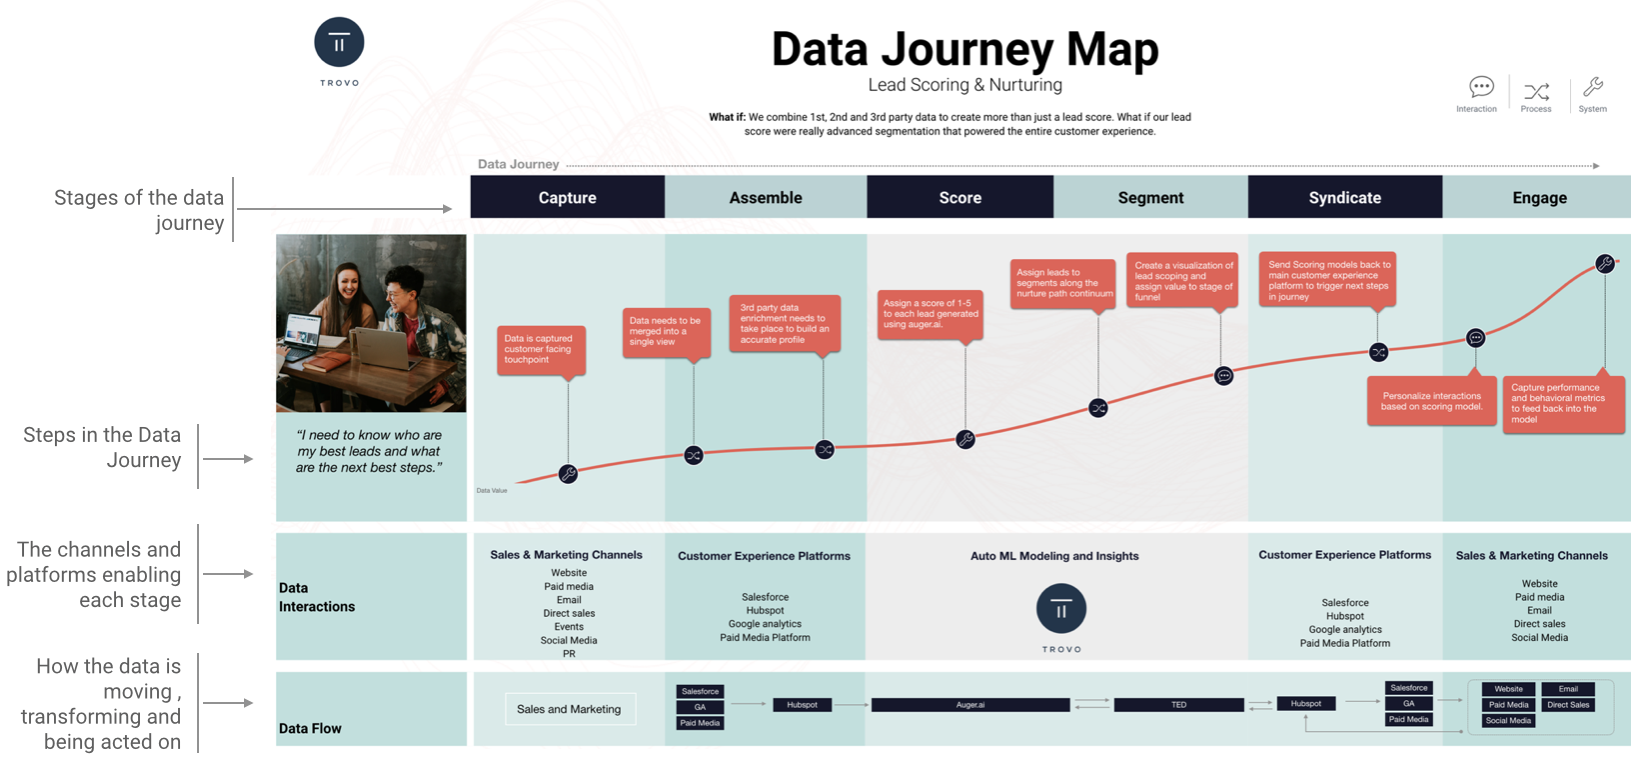
Creating a single narrative view using a Data Journey Map allows teams to effectively communicate a story and vision for how this new product will come to life.